Quick answer: To explain a budget variance to a board, state the variance in dollars and percent, explain what caused it, say whether it is a timing difference or a permanent change, describe its impact on year-end results and mission, and recommend an action. Keep it to a few sentences per variance and pair it with a simple visual.
If your board meetings feel like a tug-of-war between budget lines and blank stares, you're not alone. Most finance leaders have the numbers right. What's missing is the story that tells the board what those numbers mean and what to do about them.
This guide walks through a five-step framework for explaining budget variances, a sample script you can adapt, and why strong reporting is the first step toward smarter nonprofit budgets.
What is a Budget Variance?
A budget variance is the difference between what your organization budgeted and what actually happened for a given line, department, program, or period. A favorable variance means revenue came in higher or expenses came in lower than planned. An unfavorable variance means the opposite.
Variances are normal. Boards don't expect a budget to be perfect. They expect finance to know why results differ from the plan and what it means for the organization.
How Do You Explain a Budget Variance to a Board? 5 Clear Steps
1. State the variance clearly
Lead with the facts: the line item, the budgeted amount, the actual amount, and the difference in both dollars and percent. For example: "Program supplies are $42,000 over budget year to date, or 18%."
2. Explain the cause
Describe what drove the difference in plain language. Was it higher volume, a price increase, a delayed grant, an unplanned hire, or a one-time event? Avoid accounting jargon, and connect the cause to something the board will recognize.
3. Classify it: timing or permanent?
This is the question boards care about most. A timing variance will reverse later in the year, such as a grant payment that arrived a month late. A permanent variance changes the year-end outcome, such as a lost funder or a rate increase. Saying which one it is up front prevents unnecessary alarm and focuses discussion where it belongs.
4. Show the impact on year-end and mission
Translate the variance into what it means for the full year and for the people you serve. Will it change the projected year-end surplus or deficit? Does it affect reserves, cash flow, or a program's capacity? An updated forecast is far more useful to a board than a year-to-date number on its own.
5. Recommend an action
Close with what you plan to do, or what decision you need from the board. Options might include monitoring, reallocating budget, adjusting a program, drawing on reserves, or simply noting that no action is needed. A variance with no recommendation leaves the board to guess.
What Does a Good Budget Variance Explanation Sound Like?
Here's a sample script using a hypothetical example:
"Contributed revenue is $85,000 under budget through the second quarter, about 12%. The main driver is our spring gala, which moved from April to September. That's a timing difference, not a loss of support: commitments for the September event are already ahead of last year. Our year-end forecast still shows contributed revenue within 2% of budget. Cash remains above our three-month reserve target, so no action is needed today. We'll update you on gala results at the October meeting."
In under a minute, the board knows the size of the variance, why it happened, whether it's temporary, how the year will end, and what comes next.
What Context Do Boards Need When Reviewing Budget Variances?
Numbers without context can mislead even experienced board members. Consider two common scenarios:
A nonprofit reports a year-end "surplus," and leadership spends it, only to learn later that much of it was restricted funding that couldn't be used for general operations.
Another organization doesn't see its cash reserves shrinking until it's too late and has to cut programs mid-year.
In both cases the data existed. The reporting didn't tell the story. To avoid that, give boards context alongside every variance:
Restricted versus unrestricted funds, so a surplus or shortfall is interpreted correctly
Cash position and reserves, including months of operating cash
Budget versus actuals by month and year to date
Revenue trends by source, including concentration risk
An updated year-end forecast that compares where you're headed to the approved budget
Why is Transparent Reporting the First Step Toward Smarter Nonprofit Budgeting?
Strong variance reporting does more than get you through a board meeting. It builds the foundation for better budgeting.
It builds trust and alignment. When reports anticipate the board's questions, such as what caused a variance, whether it's one-time or ongoing, and how it affects the mission, board members spend less time decoding numbers and more time thinking strategically.
It teaches teams which questions to ask. Consistent reporting shifts attention to mission-critical KPIs, not just expenses. Teams learn to flag problems early, tie dollars to impact, and ask whether spending reflects their values and whether reserves can absorb a drop in donations.
It makes budgeting more strategic. Once reporting works, budgets are built on a shared financial language. Departments understand how their numbers roll up, and finance spends less time rewriting reports mid-year.
How Can Visuals Help Explain Budget Variances?
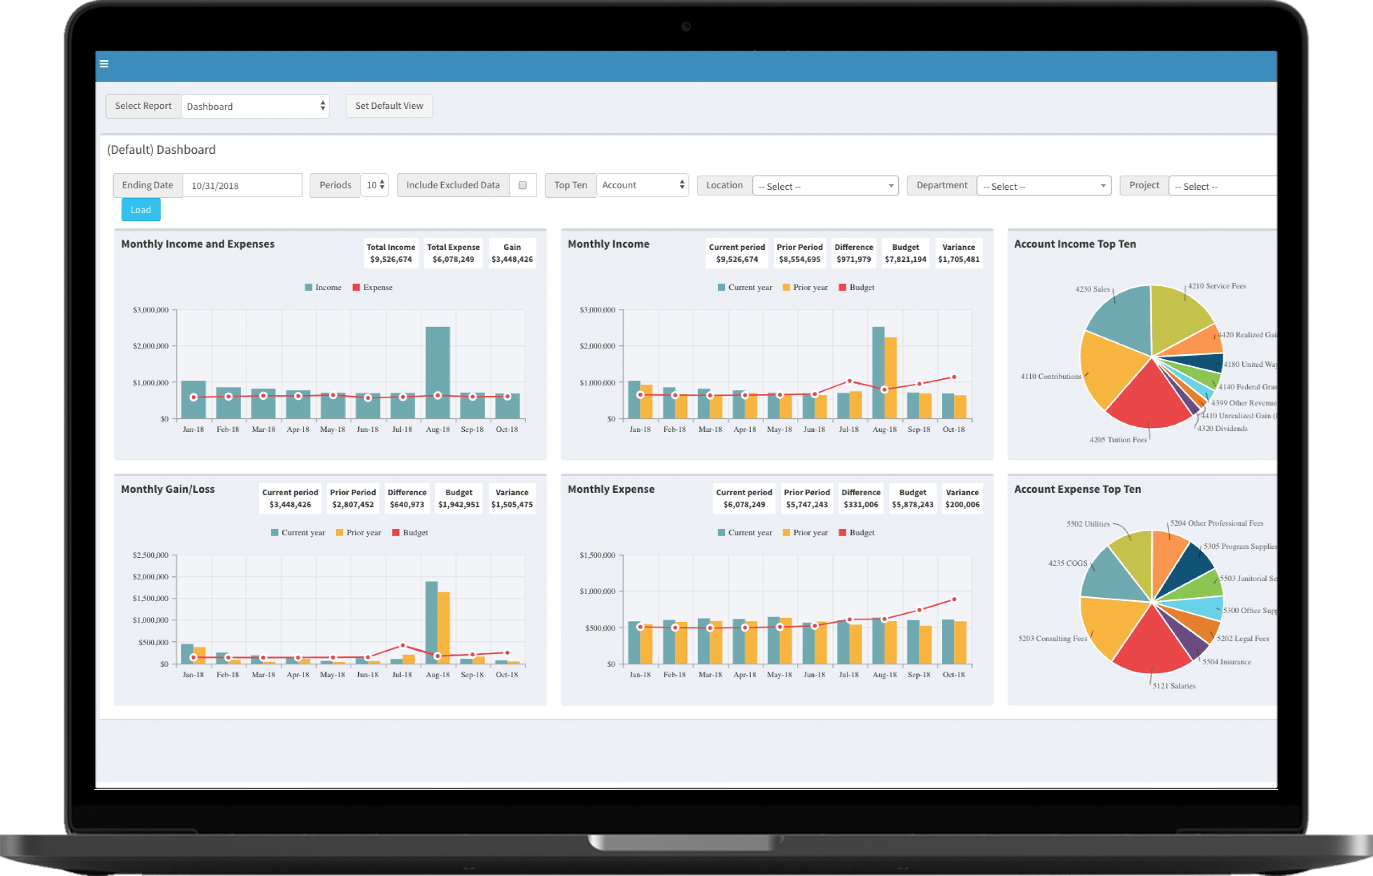
A simple chart often explains a variance faster than a table. A few that work well for boards:
Budget versus actuals bar charts by month or quarter to show where gaps opened up
Trend lines for revenue, expenses, or cash to show whether a variance is a blip or a pattern
Forecast views that combine actuals to date with projections for the remaining months
A short KPI dashboard that stays consistent from meeting to meeting
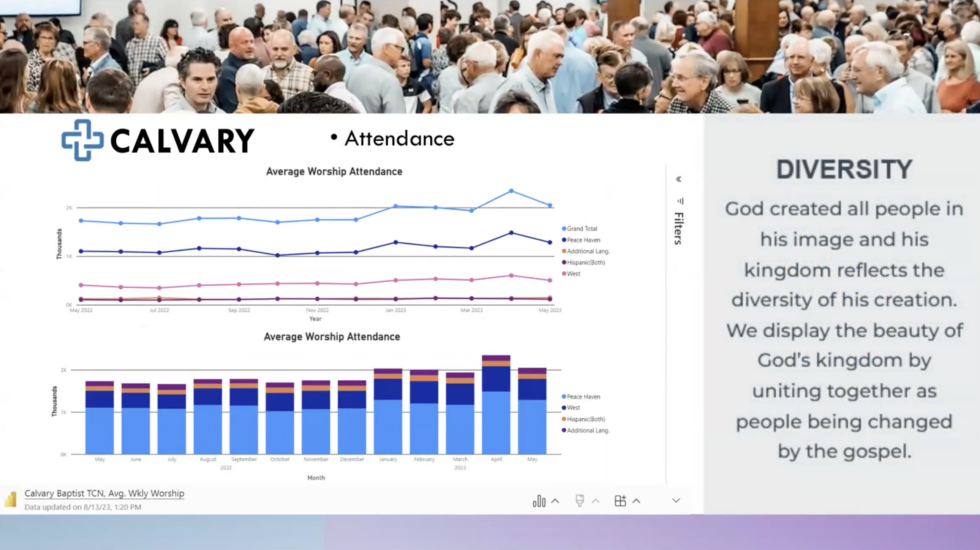
Calvary Church is one example. By pairing Martus with Power BI, its finance team replaced spreadsheet-heavy reports with interactive dashboards that update in real time and show board members exactly what they want to know.
Frequently Asked Questions
What is an acceptable budget variance for a nonprofit?
There's no universal rule. Many organizations set a threshold, such as a percentage of the line item, a dollar amount, or both, above which finance must provide a written explanation. Agree on thresholds with your finance committee so variance reporting stays focused on what's material.
Should every budget variance be explained to the board?
No. Boards should see the variances that are material to year-end results, cash, compliance, or mission delivery. Smaller variances can be handled by management or summarized in a single line.
What's the difference between a timing variance and a permanent variance?
A timing variance happens when revenue or expenses occur in a different period than budgeted and will even out later in the year. A permanent variance changes the full-year outcome and may require the board to adjust plans.
How often should nonprofits report budget variances to the board?
Most boards review budget versus actuals at each board or finance committee meeting, often monthly or quarterly. Significant unexpected variances should be communicated as soon as they're known, not held until the next scheduled meeting.
What should a variance explanation include?
The amount in dollars and percent, the cause, whether it's timing or permanent, the impact on year-end results and mission, and a recommended action or decision.
Turn Variance Reporting into A Better Board Conversation
Explaining a budget variance isn't about defending the numbers. It's about helping the board understand what changed, why it matters, and what happens next. When reporting tells that story clearly, budgets get smarter and board conversations get more strategic.
With Martus Reporting, finance teams get real-time budget versus actuals, drill-down to transactions, forecasts, and board-ready dashboards connected directly to their accounting system.










 Glen Strack